Датотека:Radiocarbon bomb spike.svg
Пређи на навигацију
Пређи на претрагу

Величина PNG прегледа за ову SVG датотеку је 600 × 480 пиксела. 4 друге резолуције: 300 × 240 пиксела | 960 × 768 пиксела | 1.280 × 1.024 пиксела | 2.560 × 2.048 пиксела.
Оригинална датотека (SVG датотека, номинално 600 × 480 пиксела, величина: 27 kB)
| Опис |
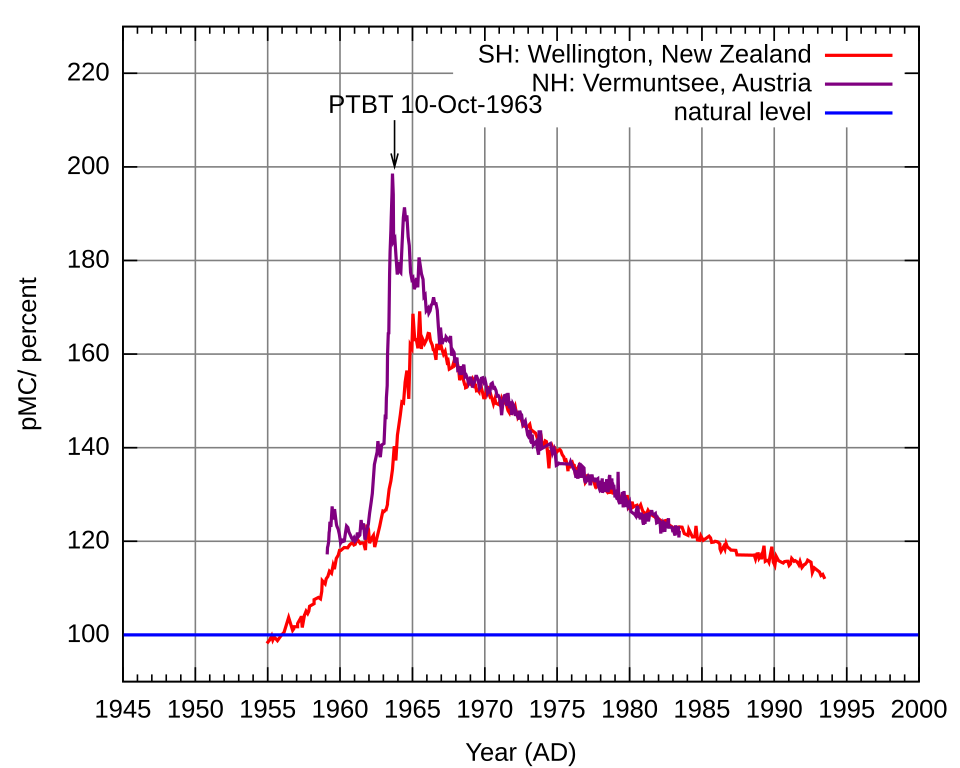
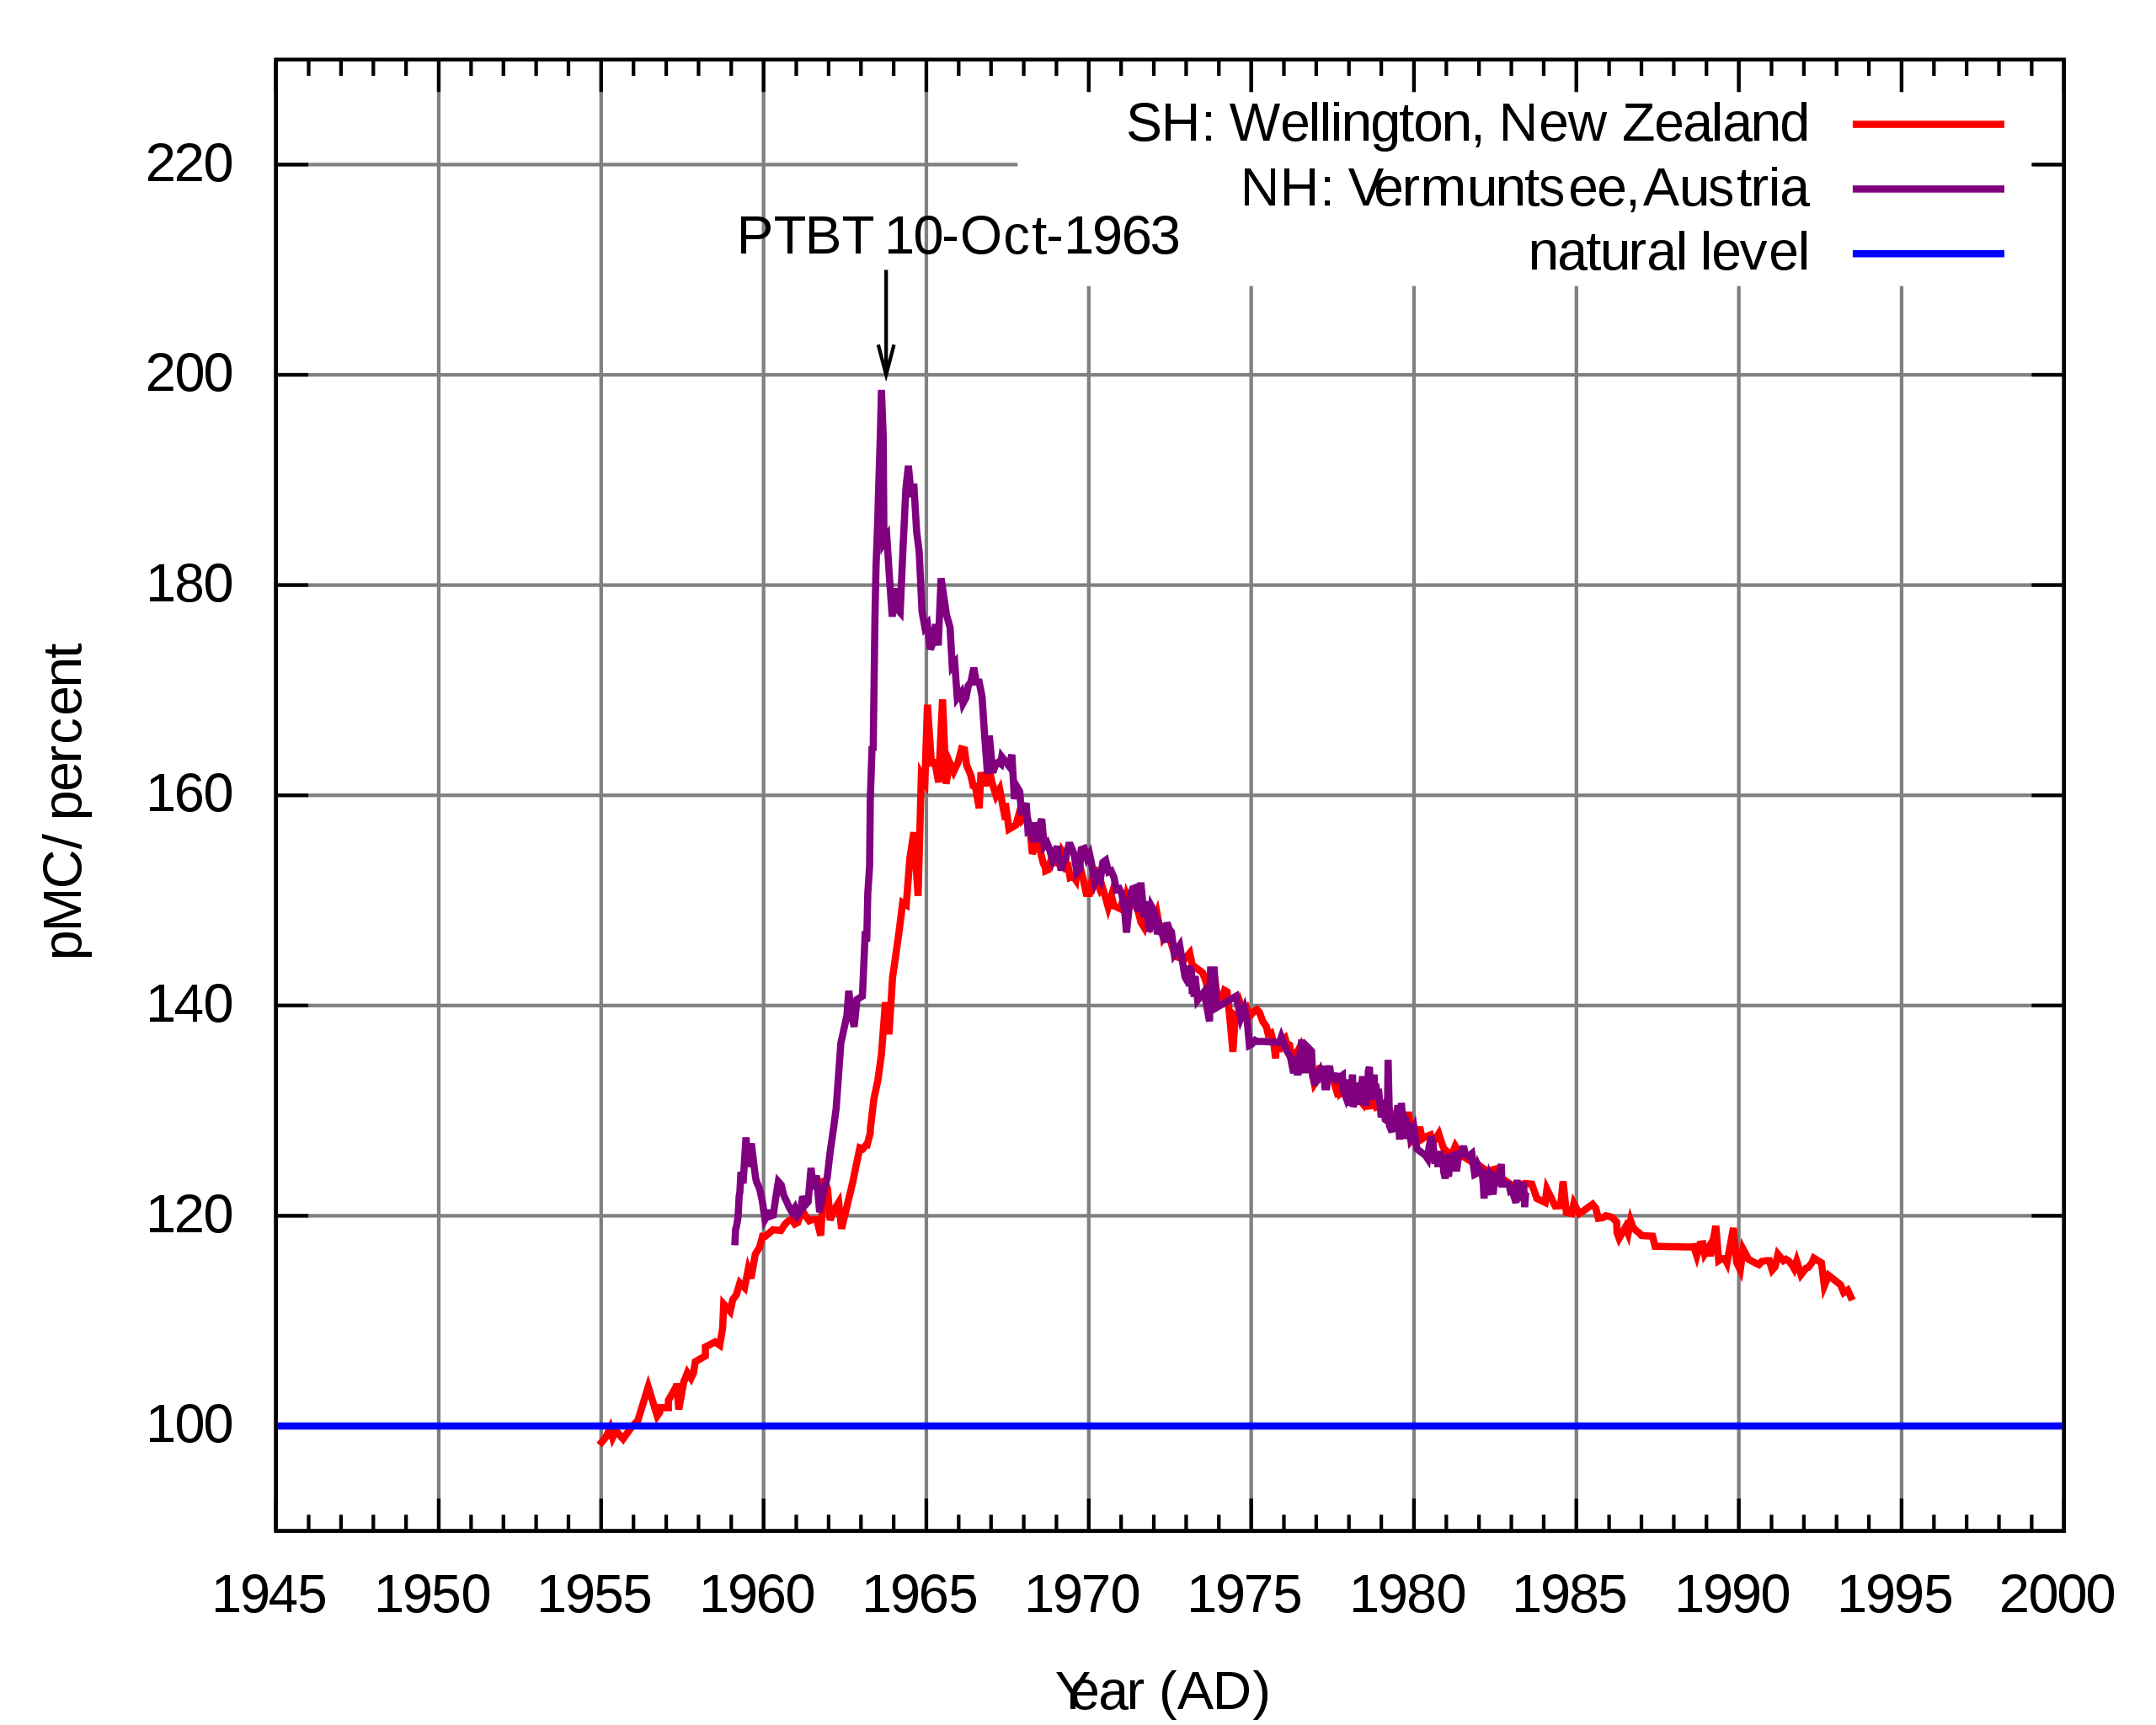
English: Atmospheric 14CO2 in the second half of the 20th century.
The figure shows the 14C / 12C ratio relative to the natural level in the atmospheric CO2 as a function of time in the second half of the 20th century. The plot was generated with gnuplot from data of atmospheric radiocarbon in Wellington, New Zealand 1954AD to 1993AD and at the Vermuntsee, Austria 1959AD to 1983AD. The SVG file from gnuplot has been improved manually. The data sources provide the data as D14C. For the plot the absolute percent modern value has been calculated assuming that each measurement was done in the same year as the respective sample was taken.Deutsch: Isotopenverhältnis 14C zu C in der Atmosphäre in der zweiten Hälfte des 20. Jahrhunderts. |
||
| Датум | AD 2008-08-09 | ||
| Извор |
Сопствено дело (Original text: Own work. Data from the following sources:)
|
||
| Аутор | Hokanomono | ||
| Дозвола (Поновно коришћење ове датотеке) |
All rights for generating the graphics shall be released. As far as I know there is no copyright protection on measurement data in general.
|
||
| Остале верзије |
|
||
| SVG genesis | |||
| Изворни код | Gnuplot codereset
set term svg enhanced
set output "plot.svg"
set xdata time
set timefmt "%Y-%m-%d"
set xrange ["1945-1-1":"2000-1-1"]
set format x "%Y"
set xtics 5*31556926
set grid
#set title 'Atmospheric ^{14}CO_{2}'
set xlabel 'Year (AD)'
set ylabel 'pMC/ percent'
#see Stuiver Polach for conversion between D14C and pMC
lambda = 1.0 / (8267 * 365.2422 * 24 * 3600)
set arrow from "1963-10-10", 210 to "1963-10-10", 200
set label "PTBT 10-Oct-1963" at "1963-10-10", 210 offset -5,0.5
plot [][90:230] "<awk '!/*/{print \"19\" $1 \"-\" $2 \"-\" $3, mktime(sprintf(\"19%02i %02i %02i 00 00 00\", $1, $2, $3)) - mktime(\"1950 01 01 00 00 00\"), $6, $7;}' welling.195" us 1:(($3+1000)*exp(-lambda*$2)*0.1) tit 'SH: Wellington, New Zealand' w lines, "<awk 'BEGIN{FIELDWIDTHS=\"1 7 5 7 5 2 3 3 4 2 3 3 5 6 5 4 3 2 1\";} /^ HD-/{a = mktime(sprintf(\"19%02i %02i %02i 00 00 00\", $8, $7, $6)); b = mktime(sprintf(\"19%02i %02i %02i 00 00 00\", $12, $11, $10)); present=mktime(\"1950 01 01 00 00 00\"); printf \"%s %g %4g %2g\\n\", strftime(\"%Y-%m-%d\", (a+b)/2), (b-a)/2, b-present, $16, $18;}' vermunt.c14" us 1:(($4+1000)*exp(-lambda*$3)*0.1) tit 'NH: Vermunt, Austria' w lines, 100 tit 'natural level'
set output
|

Историја датотеке
Кликните на датум/време да бисте видели тадашњу верзију датотеке.
| Датум/време | Минијатура | Димензије | Корисник | Коментар | |
|---|---|---|---|---|---|
| тренутна | 15:32, 10. април 2015. | | 600 × 480 (27 kB) | wikimediacommons>Hokanomono | Increase line width. |
Употреба датотеке
Следећа страница користи ову датотеку: