Датотека:Prime number theorem ratio convergence.svg
Пређи на навигацију
Пређи на претрагу

Величина PNG прегледа за ову SVG датотеку је 250 × 160 пиксела. 5 других резолуција: 320 × 205 пиксела | 640 × 410 пиксела | 1.024 × 655 пиксела | 1.280 × 819 пиксела | 2.560 × 1.638 пиксела.
Оригинална датотека (SVG датотека, номинално 250 × 160 пиксела, величина: 87 kB)
Опис
| Опис |
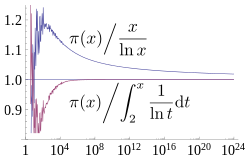
English: A plot showing how two estimates described by the prime number theorem, and converge asymptotically towards , the number of primes less than x. The x axis is and is logarithmic (labelled in evenly spaced powers of 10), going up to 1024, the largest for which is currently known. The former estimate converges extremely slowly, while the latter has visually converged on this plot by 108. Source used to generate this chart is shown below. |
| Датум | |
| Извор | Сопствено дело |
| Аутор | Dcoetzee |
| SVG genesis |


Лиценцирање
Ја, носилац ауторског права над овим делом, објављујем исто под следећом лиценцом:
| Ова датотека је доступна под лиценцом Creative Commons 1.0 Универзална – посвећивање јавном власништву. | |
| Особа која је учествовало у раду на овом документу посветила је дело јавном власништву, одричући се свих права на то дело широм света, по закону о ауторским правима и повезаним или сродним законским правима које би имао/имала, у мери дозвољеној законом. Можете да умножавате, мењате, расподељујете и прилагођавате дело, чак и у комерцијалне сврхе, без тражења дозволе.
|
Source
All source released under CC0 waiver.
Mathematica source to generate graph (which was then saved as SVG from Mathematica):
(* Sample both functions at 600 logarithmically spaced points between \
1 and 2^40 *)
base = N[E^(24 Log[10]/600)];
ratios = Table[{Round[base^x],
    N[PrimePi[Round[base^x]]/(base^x/(x*Log[base]))]}, {x, 1,
    Floor[40/Log[2, base]]}];
ratiosli =
  Table[{Round[base^x],
    N[PrimePi[
       Round[base^x]]/(LogIntegral[base^x] - LogIntegral[2])]}, {x,
    Ceiling[Log[base, 2]], Floor[40/Log[2, base]]}];
(* Supplement with larger known PrimePi values that are too large for \
Mathematica to compute *)
LargePiPrime = {{10^13, 346065536839}, {10^14, 3204941750802}, {10^15,
     29844570422669}, {10^16, 279238341033925}, {10^17,
    2623557157654233}, {10^18, 24739954287740860}, {10^19,
    234057667276344607}, {10^20, 2220819602560918840}, {10^21,
    21127269486018731928}, {10^22, 201467286689315906290}, {10^23,
    1925320391606803968923}, {10^24, 18435599767349200867866}};
ratios2 =
  Join[ratios,
   Map[{#[[1]], N[#[[2]]]/(#[[1]]/(Log[#[[1]]]))} &, LargePiPrime]];
ratiosli2 =
  Join[ratiosli,
   Map[{#[[1]], N[#[[2]]]/(LogIntegral[#[[1]]] - LogIntegral[2])} &,
    LargePiPrime]];
(* Plot with log x axis, together with the horizontal line y=1 *)
Show[LogLinearPlot[1, {x, 1, 10^24}, PlotRange -> {0.8, 1.25}],
 ListLogLinearPlot[{ratios2, ratiosli2}, Joined -> True],
 LabelStyle -> FontSize -> 14]
LaTeX source for labels:
$$ \left.{\pi(x)}\middle/{\frac{x}{\ln x}}\right. $$
$$ \left.{\pi(x)}\middle/{\int_2^x \frac{1}{\ln t} \mathrm{d}t}\right. $$
These were converted to SVG with [1] and then the graph was embedded into the resulting document in Inkscape. Axis fonts were also converted to Liberation Serif in Inkscape.
Историја датотеке
Кликните на датум/време да бисте видели тадашњу верзију датотеке.
| Датум/време | Минијатура | Димензије | Корисник | Коментар | |
|---|---|---|---|---|---|
| тренутна | 14:07, 21. март 2013. | | 250 × 160 (87 kB) | wikimediacommons>Dcoetzee | Change n to x to match article |
Употреба датотеке
2 следеће странице користе ову датотеку: